Tools
BigQuery, Tableau, Google Data Studio, Metabase, Google Sheet, Ms Excel, CleverTap
BigQuery, Tableau, Google Data Studio, Metabase, Google Sheet, Ms Excel, CleverTap
SQL, Python
Exploratory data analysis (EDA), statistics, RFM, regression and correlation, clustering, A/B testing, cohort analysis, data visualization, hypothesis testing
Problem solving, communication, critical thinking, collaboration, project management
One of the E-commerceU manager knows that EcommerceU Company has experienced a significant revenue decline in December 2020 - February 2021. They wants to know more about the causes and ways to anticipate and deal with similar incidents.
Currently the marketing strategy used by EcommerceU Company does not target a specific market or different approaches for different market segments. Therefore, E-commerceU requires recommendation support for the development of segmented marketing strategies using Customer Segmentation Analysis.
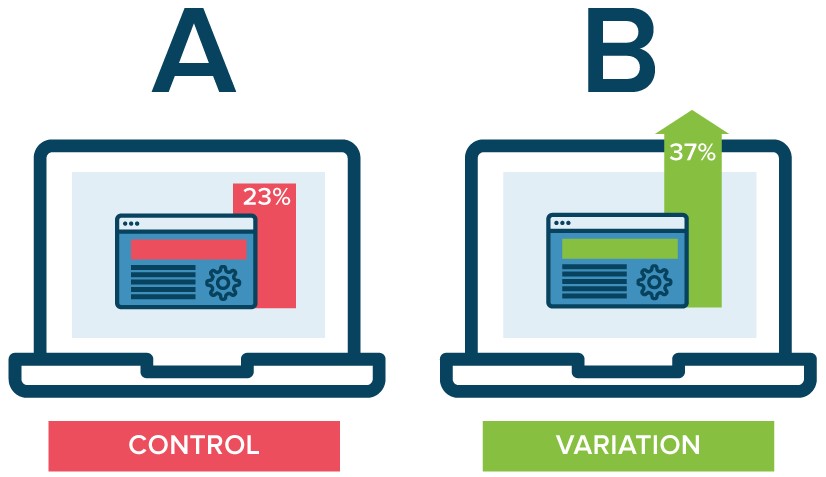
The product team made an experiment to add new features. And they want to understand the impact of the experiments that have been carried out and needs several recommendations that can be given for the continuation of adding these features.
EcommerceU companies are trying to change the way companies make decisions to be more data-driven. And one way is to develop a Business Performance Management Dashboard (KPI) for each level of management.

This assignment is the application of the skills learned in SQL class. We were given a data set and instructions to follow. These assignments require SQL skills ranging from basic to advanced levels such as window functions and CTE.

This assignment is the application of the skills that have been learned in the Data Visualization class. We were given a data set and instructions to follow. These assignments require Tableau and Google Data Studio skills from basic to advanced levels such as creating a hierarchy, calculated field, and interactive map.

This assignment is the application of the skills learned in Spreadsheet and Statistics class. We were given a data set and instructions to follow.

This project uses data from Google Finance which is generated in Google Sheets. And this is how I make it a candle stick chart.