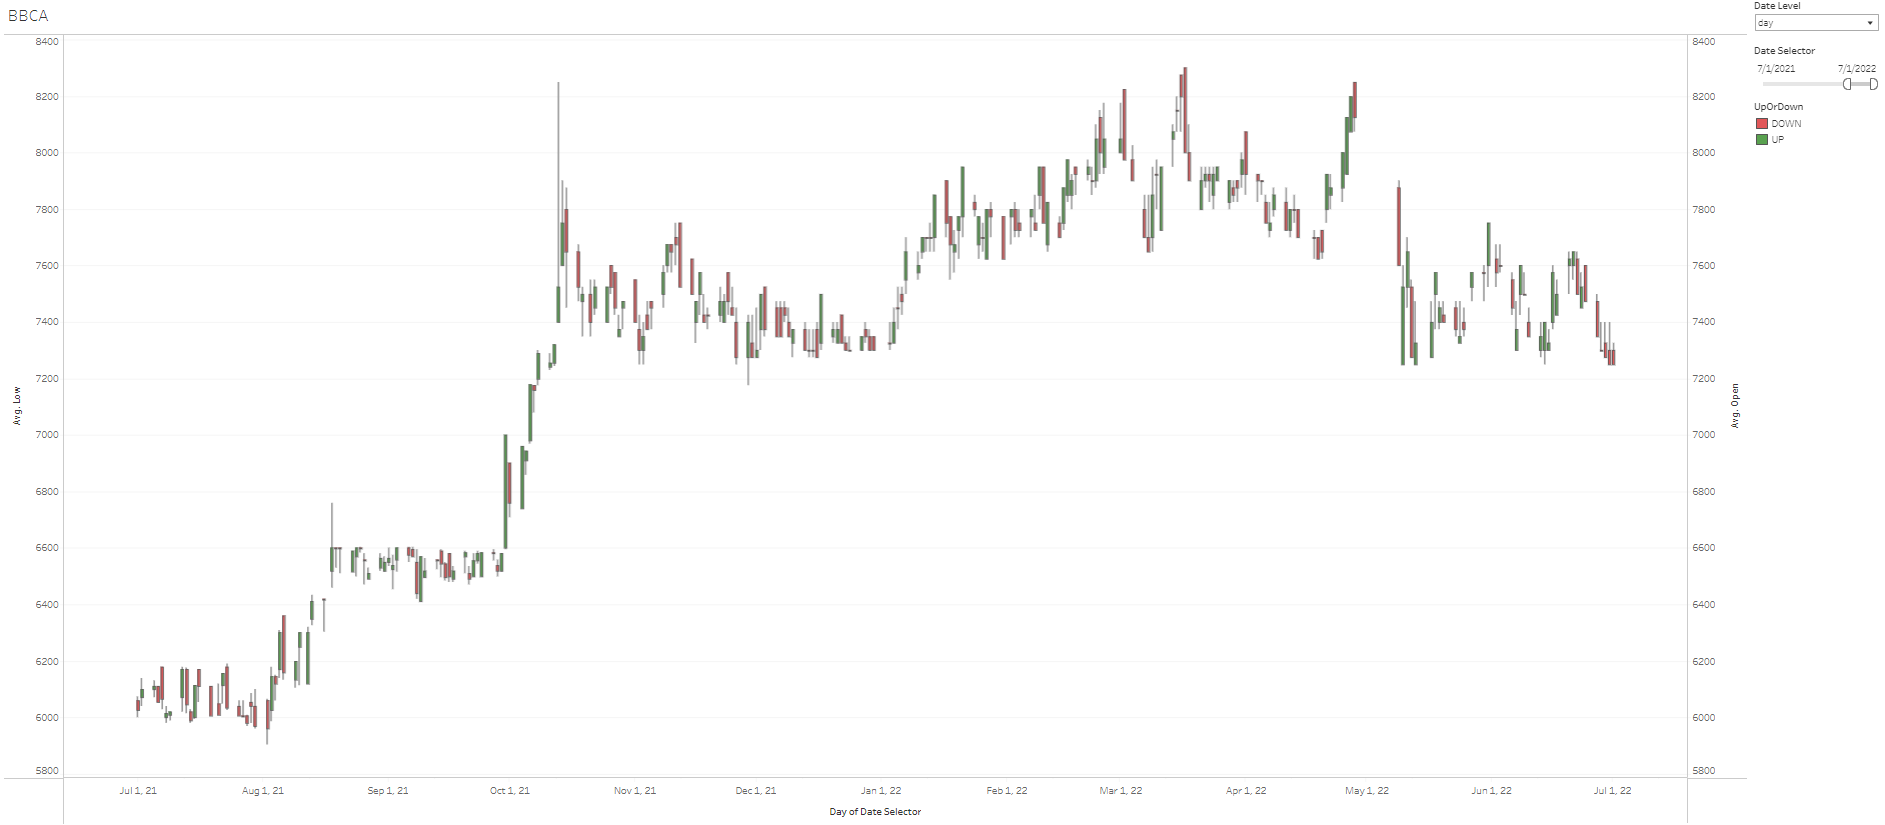
BBCA Stock Price Candle Stick
This project uses data from Google Finance which is generated in Google Sheets. Here is the code I use.
=GOOGLEFINANCE("IDX:BBCA", "all", DATE(2017,1,1), TODAY(), "DAILY")
In the chart displayed with candlesticks, you can see the movement of BBCA's stock price per day, starting from the open price, close price, highest price, lowest price, and candle status (up or down). You can also customize the appearance by setting date filters and date levels.
To view and use graphic filters, visit my public table here.