E-commerceU Exploratory Data Analysis (EDA) and Churn Analysis
About the project
There is a sharp decrease in revenue generated by the eCommerceU throughout the year of 2021 compared to the previous year. The company suffers revenue loss of 33.5% from IDR 8.1 billion to IDR 5.4 billion (IDR -2.7 billion). The managers want to know more about the causes and ways to anticipate and deal with similar incidents.
Summary
The decrease in total revenue was caused by 4 things, that is a decrease in new registered users, a small second month cohort rate, a decrease in monthly retention rate, and a decrease in revenue per transaction.
Number of Customer & Revenue per Transaction Problem
The decline in revenue in Q4 2021 when compared to Q4 2020 is one of the causes of the decline in total revenue in 2021. And one of the reasons for this is the decrease in the number of customers in Q4 2021.
The second cause of the decline in revenue is the decline in revenue per transaction in 2021 by 34%, especially in Q4.
Average Revenue Per Customer went down by 38% in 2021. And revenue per Transaction also went down by 34%. This is also the reason why Q4 revenue fell considerably even though the decrease in the number of customers in Q4 was not as much as the decrease in the number of transactions in Q4.
New Registered User, Cohort Second Month, & Avg Monthly Retention Rate Problem
One of the reasons for the decline in the number of customers in 2021 is the decline in the number of new registered users
In 2021, only 72 customer that are new users, about 2% of the total customers that transacted. While the number of customers who are existing users are 1146 people (90%)
The number of new registered users fell from 1423 users in 2020 to 107 users in 2021. This is exacerbated by a sharp downward trend. And not corrected at all in 2021.
Another reason for the decline in customers in 2021 is the decrease in the average monthly retention rate in 2021 compared to 2020. There has been a 8.1% decrease in average monthly retention rate from 2020 to 2021
What wasn't repeated in Q4 2021 was the high retention rate in Q4 2020. Average retention rate in Q4 2020 reached 26%. While the retention rate in Q4 2021 is only 18%.
And in general, the reason for the decline in customers is a drastic decrease in the number of customers in the second month cohort. There are about 75% of customers who do not return to transactions in the following month.
The Decrease in Revenue per Transaction Problem
There is a decrease of 38% average revenue generated per buyer even though the number of average transaction per buyer only decreased by 5.5%.
There are several reasons that might be the reason why the number of average transaction does not show the same decline as average revenue per transaction generated.
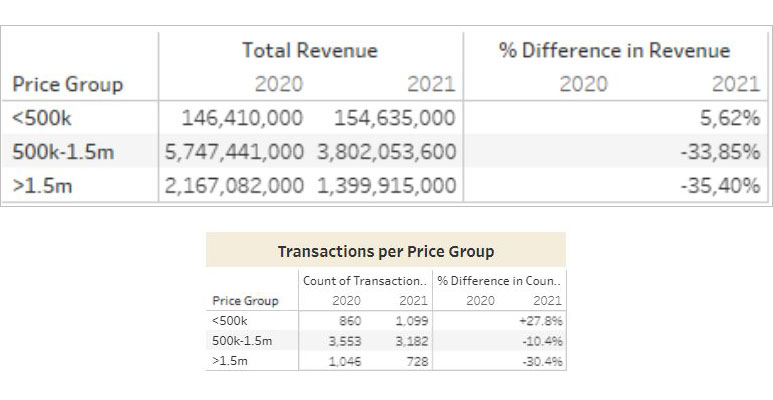
On the graph below, we identified that product with price below IDR 500,000 shows increase in revenue generated of 5.62%, the other 2 price groups show significant decline in revenue generation. Product with price between IDR 500,000 - IDR 1,500,000 shows decline of 33.85% in revenue generated and the product with price above IDR 1,500,000 shows steep decline of 35.40%.
The number transactions per price group are also showing the same pattern as revenue generation per price group.
Other Findings
Customers with the Highest Retention Rate Purchase the Most Products in the Electronics and Hobby Categories. This is, in contrast to the Low Retention Rate Customer
In terms of gender and province, there is not much difference between high retention and low customer retention
One customers can buy electronic products up to an average of 15 different transactions, while hobbies have 13 different transactions, and the other only 2 different transactions.