Skip to content
Adharul Imron

In God we trust. All others must bring data.

Hi, I'm Imron

A Data Analyst with experience in Growth and Product Marketing

Released 20+ product campaigns and analyzed user fraud in a promotional program to successfully secure tens of millions of rupiah marketing budget. I also have experience in data visualization and visualizing multiple presentation decks and project reports.

Right now, I want to explore new possibilities in Data Analytics and/or Business Intelligence. Data Analytics successfully combines aspects of work that I love such as engineering, working with numbers, visualization, and communication. I really want to contribute to the progress of a business by using data.

Recently finished my Full Stack Data Analysis Program at RevoU. Currently participating in the special program Virtual Labs RevoU x Tokopedia.

Portrait of Adharul Imron smiling, wearing a tan sweatshirt over a white collared shirt

Selected Work

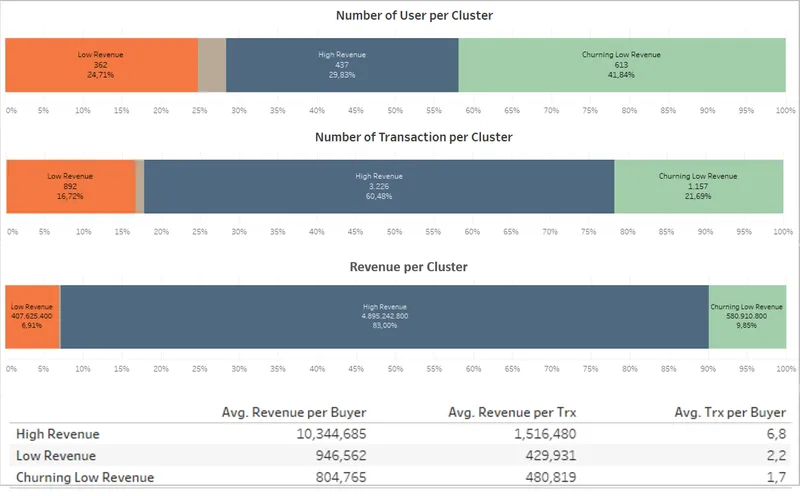
E-commerceU Marketing Strategy Based On Customer Segmentation

Currently the marketing strategy used by E-commerceU Company does not target a specific market or different approaches for different market segments. Therefore, E-commerceU requires recommendation support for the development of segmented marketing strategies using Customer Segmentation Analysis.

  • Python
  • RFM
  • K-means
Stacked bar charts of the number of users, number of transactions and revenue per customer cluster, with a table of average revenue per buyer, average revenue per transaction and average transactions per buyer

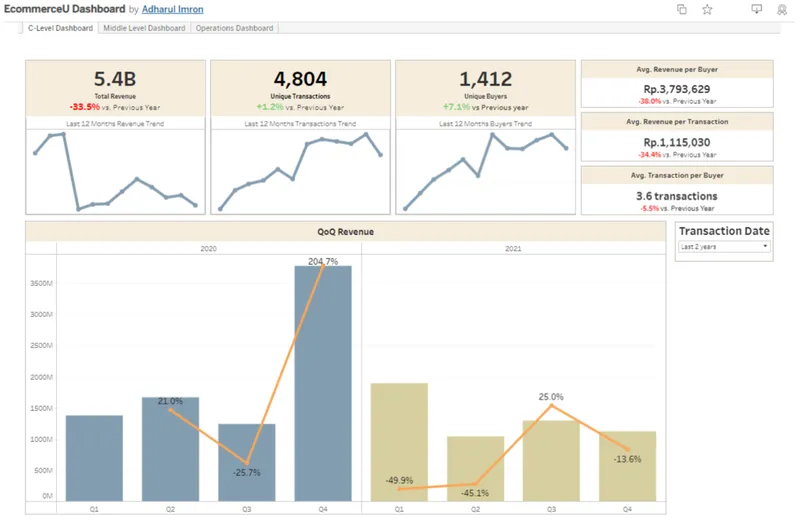
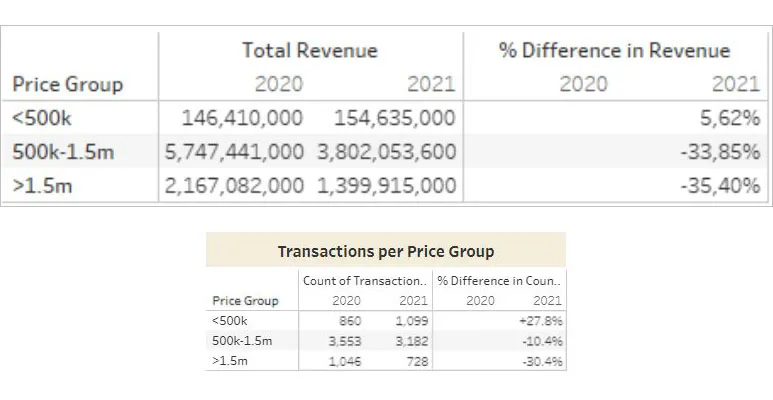
E-commerceU Exploratory Data Analysis (EDA) and Churn Analysis

One of the E-commerceU manager knows that E-commerceU Company has experienced a significant revenue decline in December 2020 - February 2021. They want to know more about the causes and ways to anticipate and deal with similar incidents.

Two tables of total revenue and number of transactions by price group (under 500k, 500k to 1.5m, above 1.5m) for 2020 and 2021

Skills

Tools

  • BigQuery
  • Tableau
  • Google Data Studio
  • Metabase
  • Google Sheet
  • Ms Excel
  • CleverTap

Programming Language

  • SQL
  • Python

Technical Knowledge

  • Exploratory data analysis (EDA)
  • Statistics
  • RFM
  • Regression and correlation
  • Clustering
  • A/B testing
  • Cohort analysis
  • Data visualization
  • Hypothesis testing

Others

  • Problem solving
  • Communication
  • Critical thinking
  • Collaboration
  • Project management
Course work & more
  • E-commerceUFeature Roll-Out Adoption

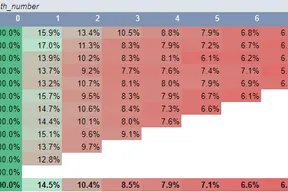
    E-commerceU Feature Roll-Out Adoption Analysis

    The product team made an experiment to add new features. And they want to understand the impact of the experiments that have been carried out and needs several recommendations that can be given for the continuation of adding these features.

  • Cohort table of retention percentages by cohort month and month number, shaded from green to red

    RevoU - SQL Assignment

    This assignment is the application of the skills learned in SQL class. We were given a data set and instructions to follow. These assignments require SQL skills ranging from basic to advanced levels such as window functions and CTE.

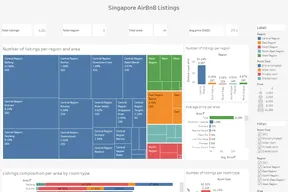
  • Tableau dashboard titled Singapore AirBnB Listings with a treemap by region and area, bar charts by room type and price range, and a map

    RevoU - Tableau and Google Data Studio Assignment

    This assignment is the application of the skills that have been learned in the Data Visualization class. We were given a data set and instructions to follow. These assignments require Tableau and Google Data Studio skills from basic to advanced levels such as creating a hierarchy, calculated field, and interactive map.

  • RevoUSpreadsheet and Statistics

    RevoU - Spreadsheet and Statistics Assignment

    This assignment is the application of the skills learned in Spreadsheet and Statistics class. We were given a data set and instructions to follow.

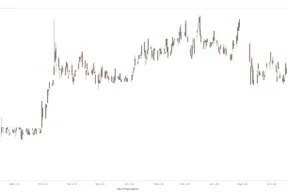
  • Candlestick chart of the BBCA stock price by day, with up days in green and down days in red

    BBCA Stock Price Candle Stick

    This project uses data from Google Finance which is generated in Google Sheets. And this is how I make it a candle stick chart.

Get in touch

If you have any question, want to ask business enquiries or want to collaborate, please do not hesitate to contact me.